


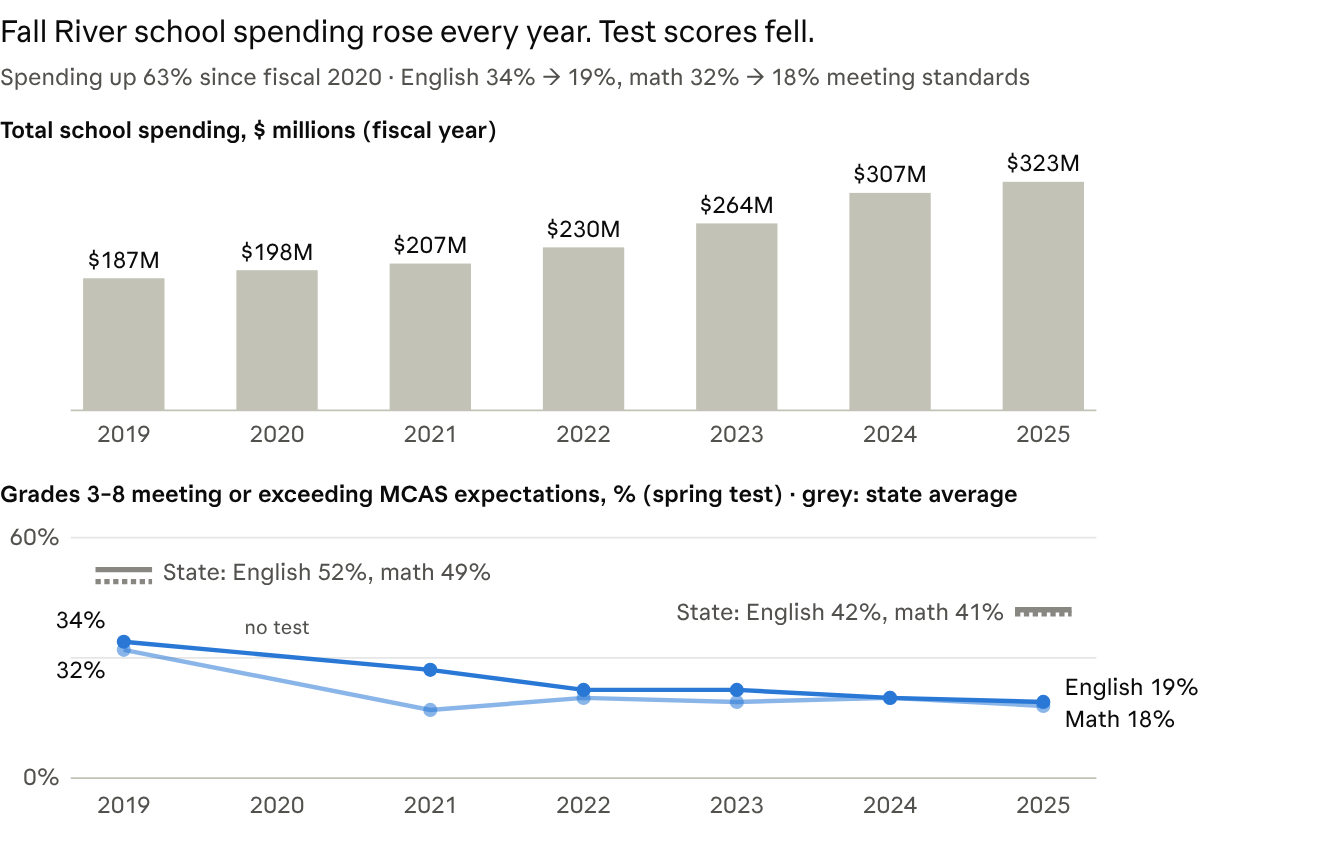
Fall River Public Schools spent $323 million in fiscal 2025, up from $198 million in fiscal 2020, a 63% increase, according to state education data. Over the same years, the share of students in grades 3–8 meeting state standards in English fell from 34% before the pandemic to 19%, and in math from 32% to 18%. The district’s four-year graduation rate rose, from 71.4% for the class of 2020 to 76.8% for the class of 2025.
Most of the new money came from the state, under a 2019 law that sharply raised aid to lower-income districts, plus about $61 million in federal pandemic relief. Most of it went to more staff: the district added about 190 teachers and more than 200 paraprofessionals.
Where the money came from
The state paid for most of the increase. Fall River’s Chapter 70 school aid rose from $130.9 million in fiscal 2020 to $202.3 million in fiscal 2025, up $71.4 million, under the Student Opportunity Act. It reaches $250.6 million in fiscal 2027.
- State aid: the 2019 law raised the state’s school funding formula for districts with many low-income students and English learners, phased in over several years.
- Federal pandemic relief: the district was allocated $4.7 million, $17.4 million and an estimated $39.2 million in three rounds of federal relief (ESSER I, II and III), about $61 million in all, to be spent by September 2024.
- The city’s share: Fall River has spent at or just under the state’s required minimum on schools. From fiscal 2018 to 2022 it spent 98% to 100% of its required amount; the statewide average was about 126% of the required amount.
That means the spending increase was largely set by state formula and federal grants, not chosen by the city. How the district used the money was its own decision.
Where the money went
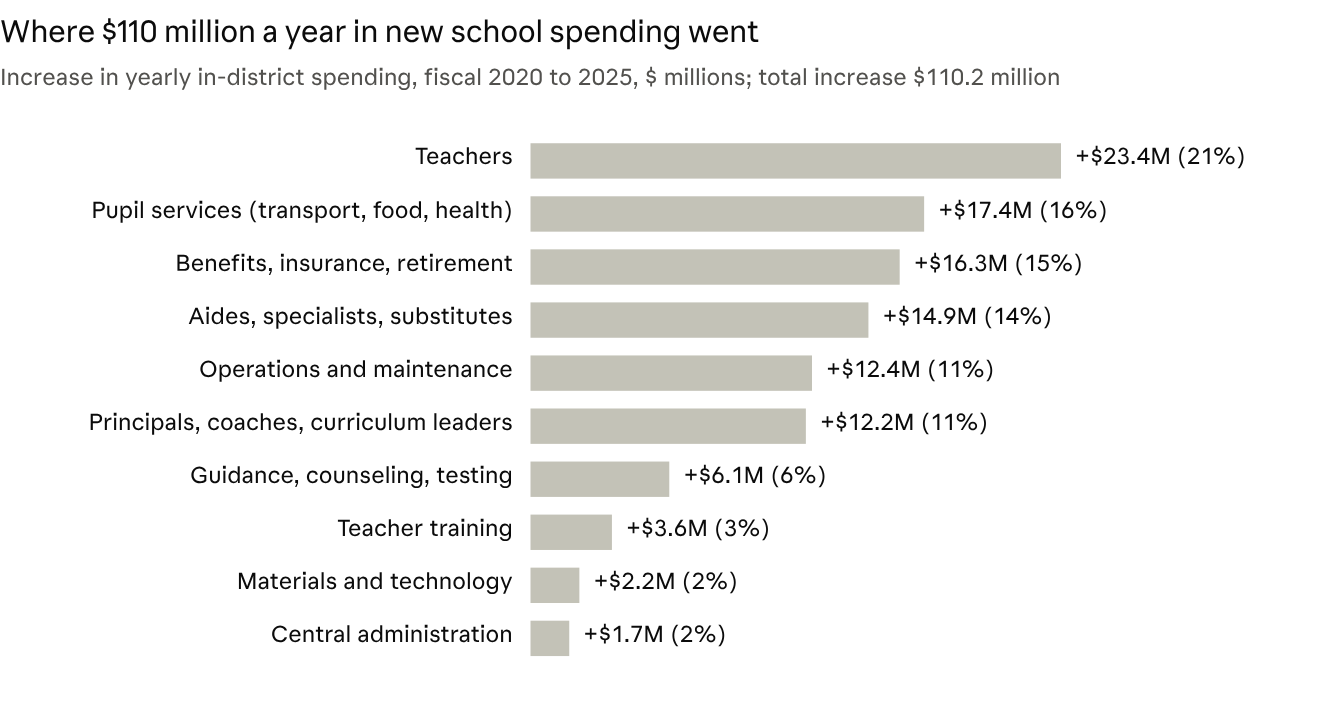
Per student, almost every category grew faster than consumer prices, which rose about 23% over these years. Teachers took the largest share of the new money, but teacher spending per student grew more slowly than most categories: up 31%, from $5,514 to $7,202. Spending on aides, specialists and substitutes more than doubled per student (up 118%).
Enrollment rose about 8% in these years, from 10,372 to 11,193 full-time students. The share of English learners rose from 19.0% to 26.4%, and the share of students with disabilities from 22.6% to 25.9%. Both groups cost more to teach, and the state formula sends more money for them.
Staff positions, 2019-20 vs. 2025-26 (full-time equivalents, state staffing reports; 2025-26 as reported so far):
| Role | 2019-20 | 2025-26 | Change |
|---|---|---|---|
| Teachers | 708 | 923 | +215 |
| Paraprofessionals (aides) | 259 | 513 | +254 |
| Instructional coaches | 34 | 80 | +47 |
| Adjustment counselors, psychologists, social workers | 36 | 74 | +38 |
| Special education specialists (speech, OT, others) | 44 | 95 | +51 |
| Office and clerical staff, IT | 107 | 142 | +35 |
| All staff | 1,374 | 2,109 | +735 |
What changed for students
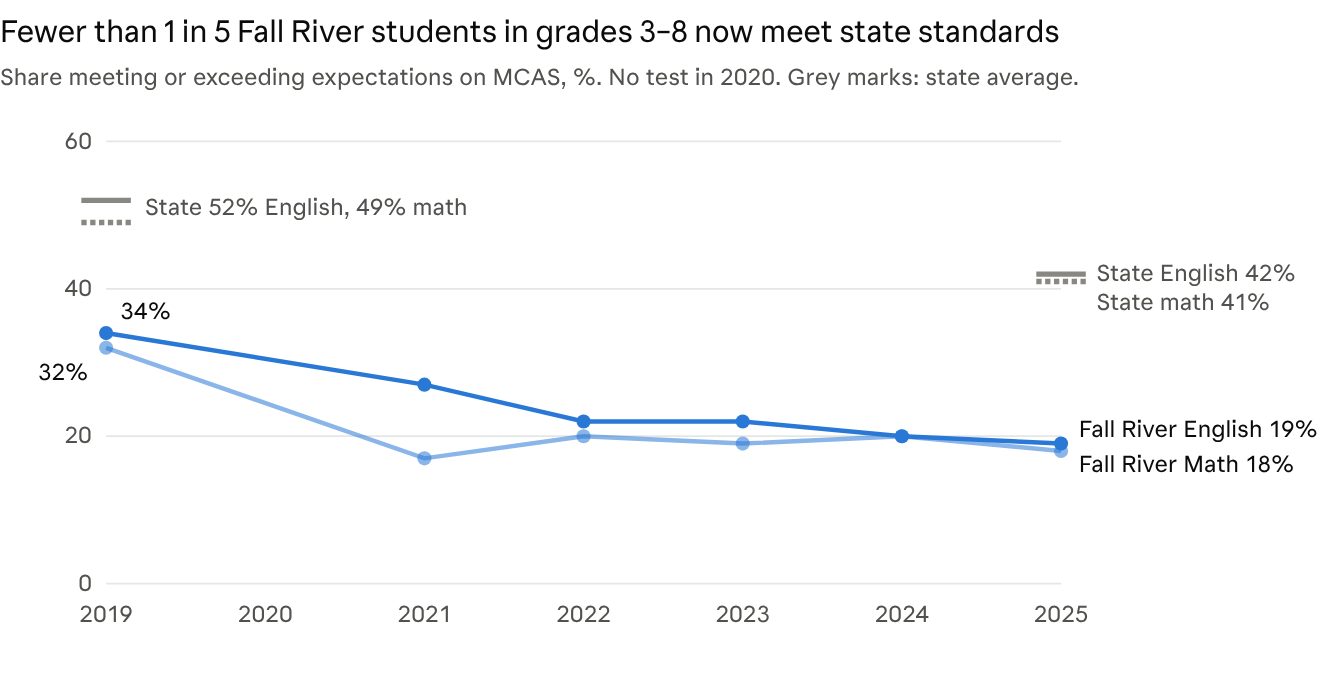
Test results have not recovered since the pandemic, and Fall River fell further than the state. Statewide, the share of students in grades 3–8 meeting expectations in English went from 52% in 2019 to 42% in 2025; in Fall River it went from 34% to 19%. Grade 10 results show the same pattern: 32% met expectations in English and 17% in math in 2025, against 51% and 45% statewide.

Graduation rates moved the other way, though not steadily, and the district’s teaching staff became much less experienced:
| Class / school year | 4-year graduation rate | Experienced teachers | Teachers working in their licensed field |
|---|---|---|---|
| 2020 | 71.4% | 74.1% | 88.9% |
| 2021 | 79.7% | 74.4% | 92.5% |
| 2022 | 78.8% | 73.3% | 91.7% |
| 2023 | 74.5% | 64.4% | 82.9% |
| 2024 | 66.4% | 60.4% | 80.6% |
| 2025 | 76.8% | 50.6% | 72.7% |
Graduation rate is for the class graduating that spring; teacher figures are for the school year ending that spring. The state graduation rate was 89.0% in 2020 and 89.3% in 2025. Statewide, the share of experienced teachers fell from 82.6% to 73.2% over the same years; in Fall River it fell almost 24 points. In New Bedford it fell from 74.0% to 60.2%.
B.M.C. Durfee High School alone graduated 83.6% of its class of 2025, and 88.5% on the state’s adjusted measure, a record for the school, according to the district. The district rate is lower because it includes the alternative and therapeutic programs. About 15% of the district’s class of 2025 dropped out at some point in their four years.
Rising diplomas, falling scores
The class of 2025 was the first that did not have to pass MCAS to graduate. Voters approved Question 2 in November 2024 with 59% support, removing the 10th-grade MCAS requirement in English, math and science. Fall River’s graduation rate jumped from 66.4% to 76.8% that year. The district also said it would award diplomas to former students who had met every requirement except MCAS since 2003.
That timing does not by itself show the change caused the jump. The statewide graduation rate barely moved (89.0% in 2020, 89.3% in 2025), and Fall River’s rate had been near 80% in 2021 and 2022, when MCAS was still required. The district credits gains among students with disabilities and English learners at Durfee.
A report from the Voices for Academic Equity Coalition, covered Nov. 16 by State House News Service, a group that includes opponents of Question 2, found that 224 of the state’s districts set passing grades at 65% or lower, some as low as 50%. Comparing 2025 graduation rates with MCAS results in the 26 Gateway Cities, which include Fall River, it found gaps of 28 to 47 points between graduation rates and the share of students scoring “Not Meeting Expectations” on MCAS. The coalition wants the state to set a common passing grade. Fall River’s own passing grade and what replaced MCAS in its graduation requirements are questions for the district.
What the numbers show, and what they don’t
The state’s figures show that spending rose sharply, mostly on more staff, while test scores stayed near their lowest point. They don’t show why. The same years brought a pandemic, more English learners and students with disabilities, a wave of new teachers, and the end of the MCAS graduation requirement. The data can’t separate those effects, and no one has measured what scores would have been without the extra money.


